You wouldn’t walk five blocks to pay $5 for a bagel if you could get that same one for $2 across the street, would you?
But let’s say you didn’t know there was a better and more affordable option right next store. Then you would walk five blocks and pay $5 for one, right?
In business operations management, process mapping lets you see that cheaper, faster option you could have bypassed. However, instead of saving 10 minutes and $3, you save dozens of hours and — potentially — thousands of dollars every month.
Process mapping is the first step to identifying and improving inefficient processes at work. It lets you visualize every detail, understand dependencies, and determine what to cut, automate, or outsource.
Read on to learn what it’s all about, why you should care, and how to map your processes to improve operations, boost efficiency, and claim back potentially lost dollars for your organization.
Jump to a section:
- What is process mapping in operations management?
- Why even map your operations processes?
- How to create a process map for your business operations
What is Process Mapping in Business Operations?
In operations management, process mapping is a method used to illustrate the workflows and activities that power business outcomes.
Much like an actual map—of, say, San Francisco—a process map shows what it takes to go from point ‘A’ to point ‘B’ (and even ‘Z’). That includes what tasks need to be done, who is responsible for each task, and how those people get the tasks done.
“A process map is like an actual map, but instead of Starbucks and Walmarts for landmarks, you have ‘Attract leads’ and ‘Convert them.’ Instead of ‘turn right’ or ‘turn left,' you have ‘Create contact’ or ‘Change lead status.”
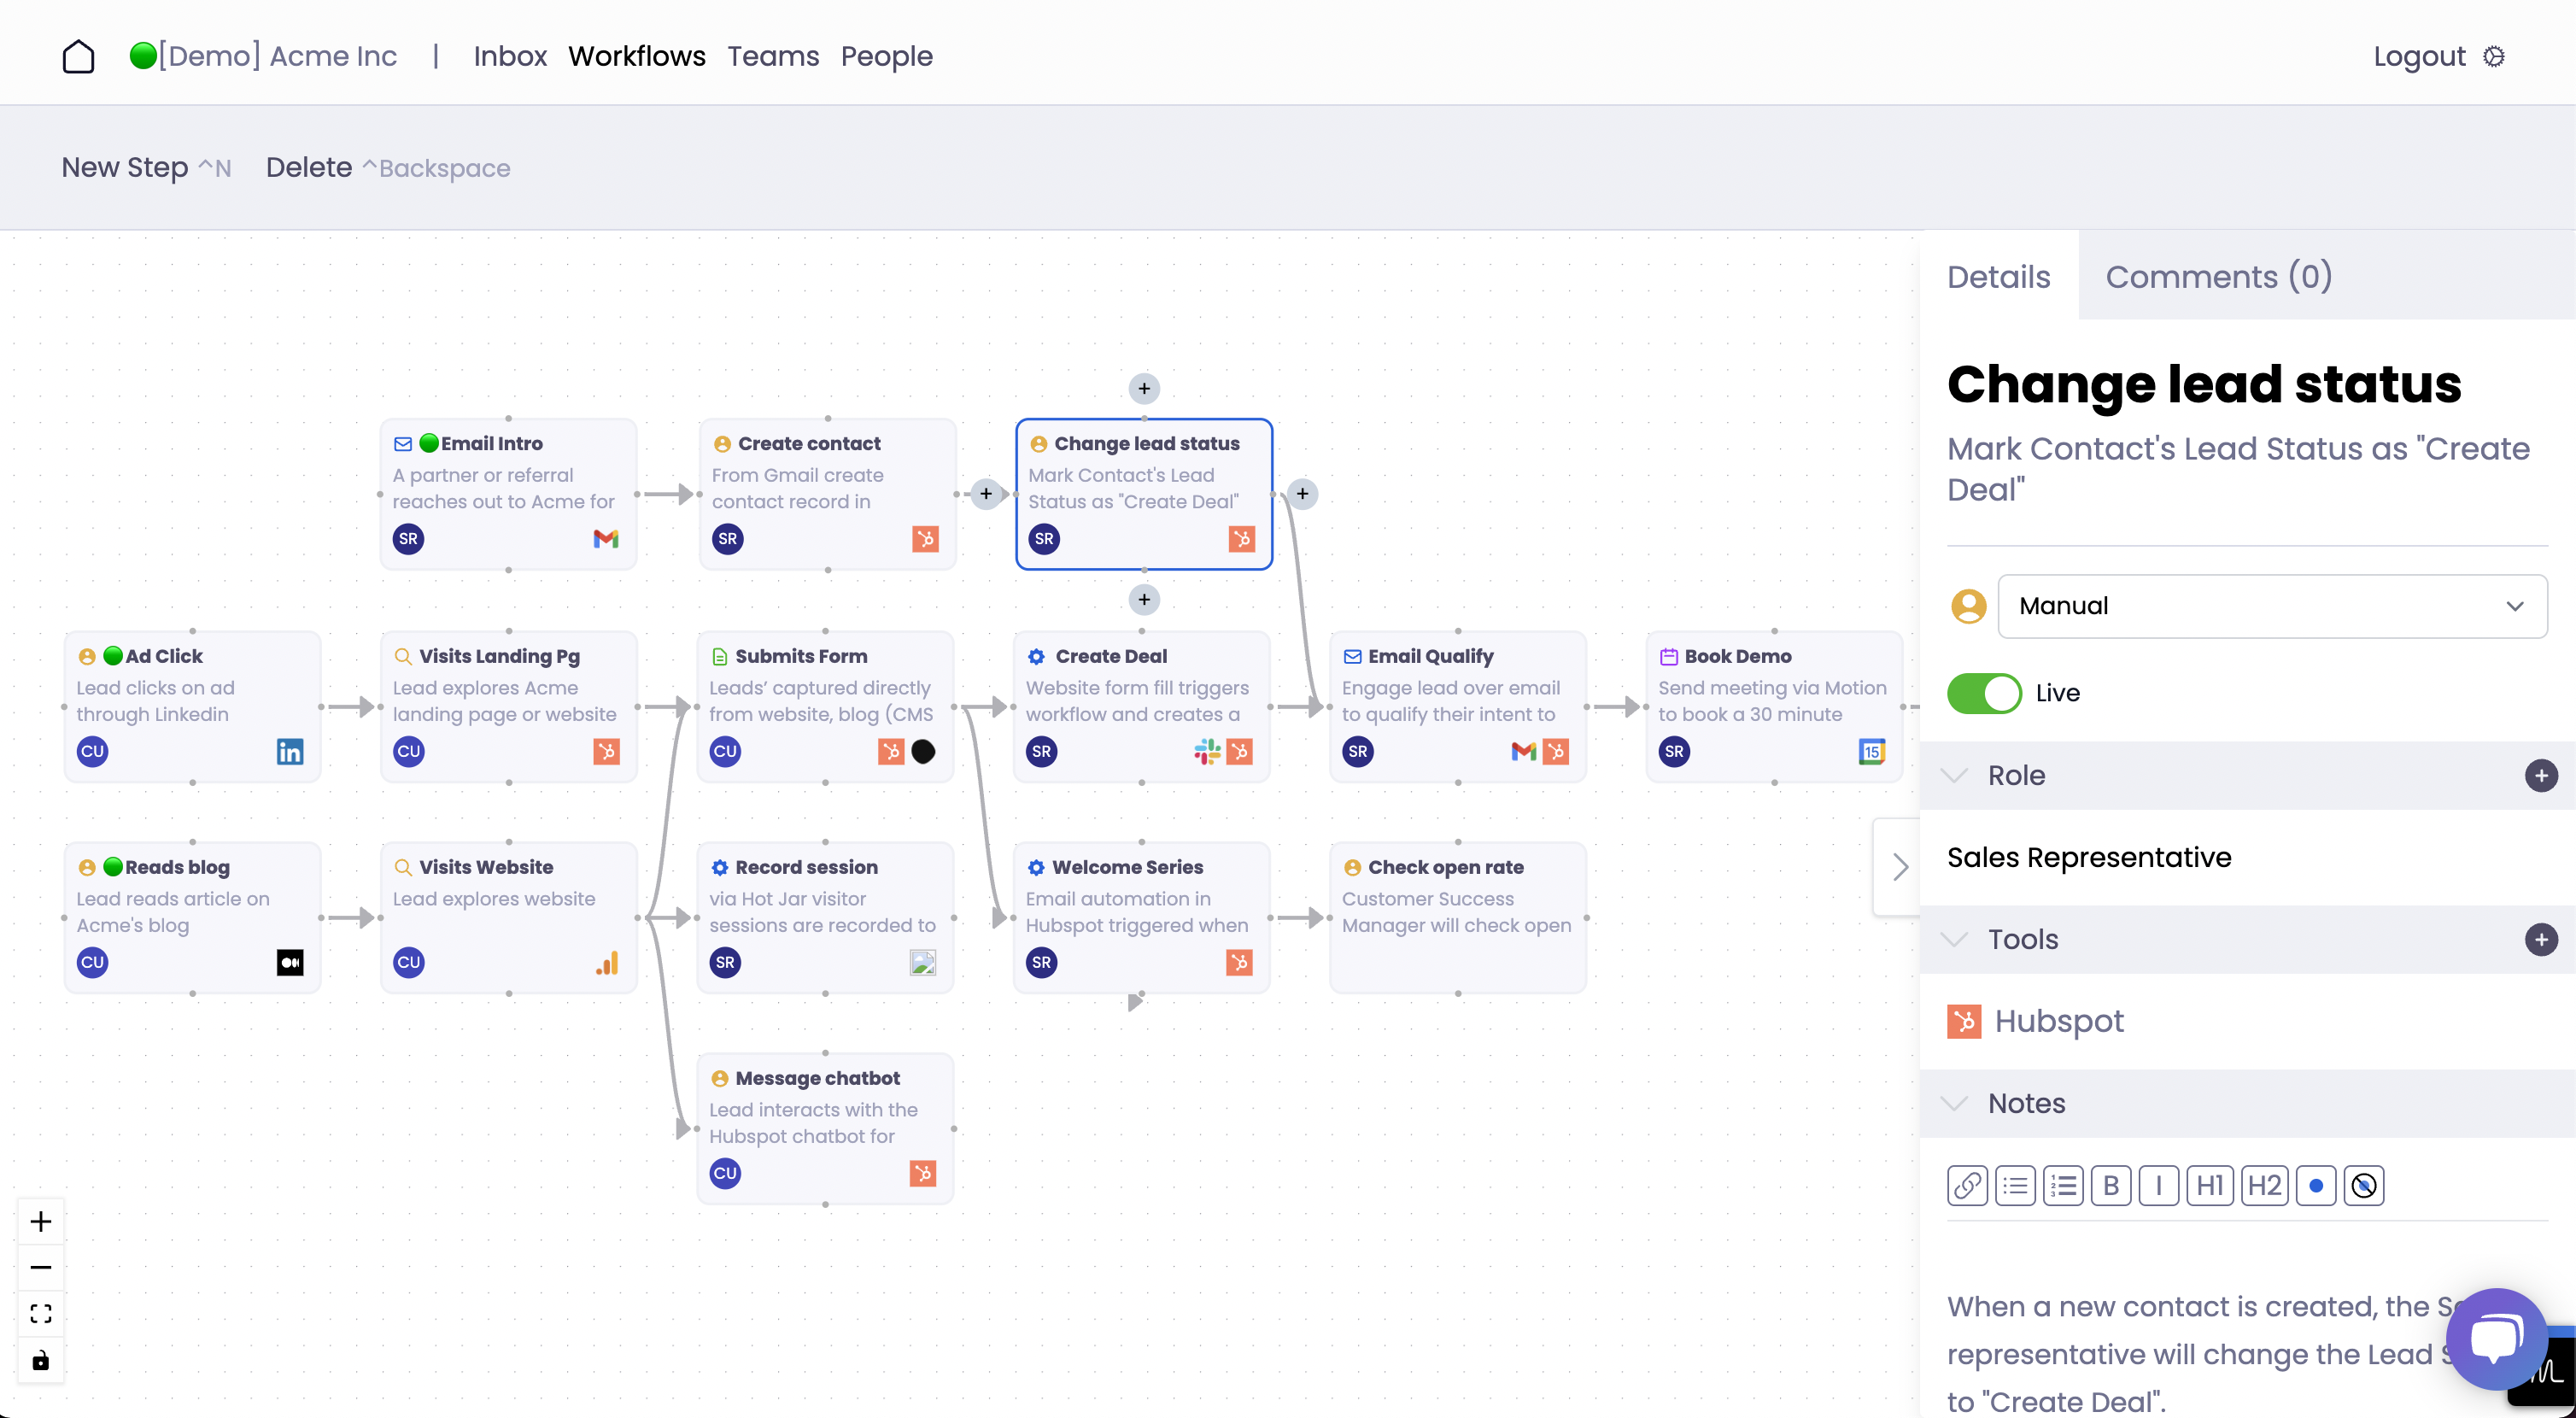
The goal is to identify opportunities for improvement in operational efficiency. A process map can show the high-level structure and processes at the organizational level. Or more departmental-specific workflows. This one, for example, shows the process of converting prospects into customers for sales and marketing.
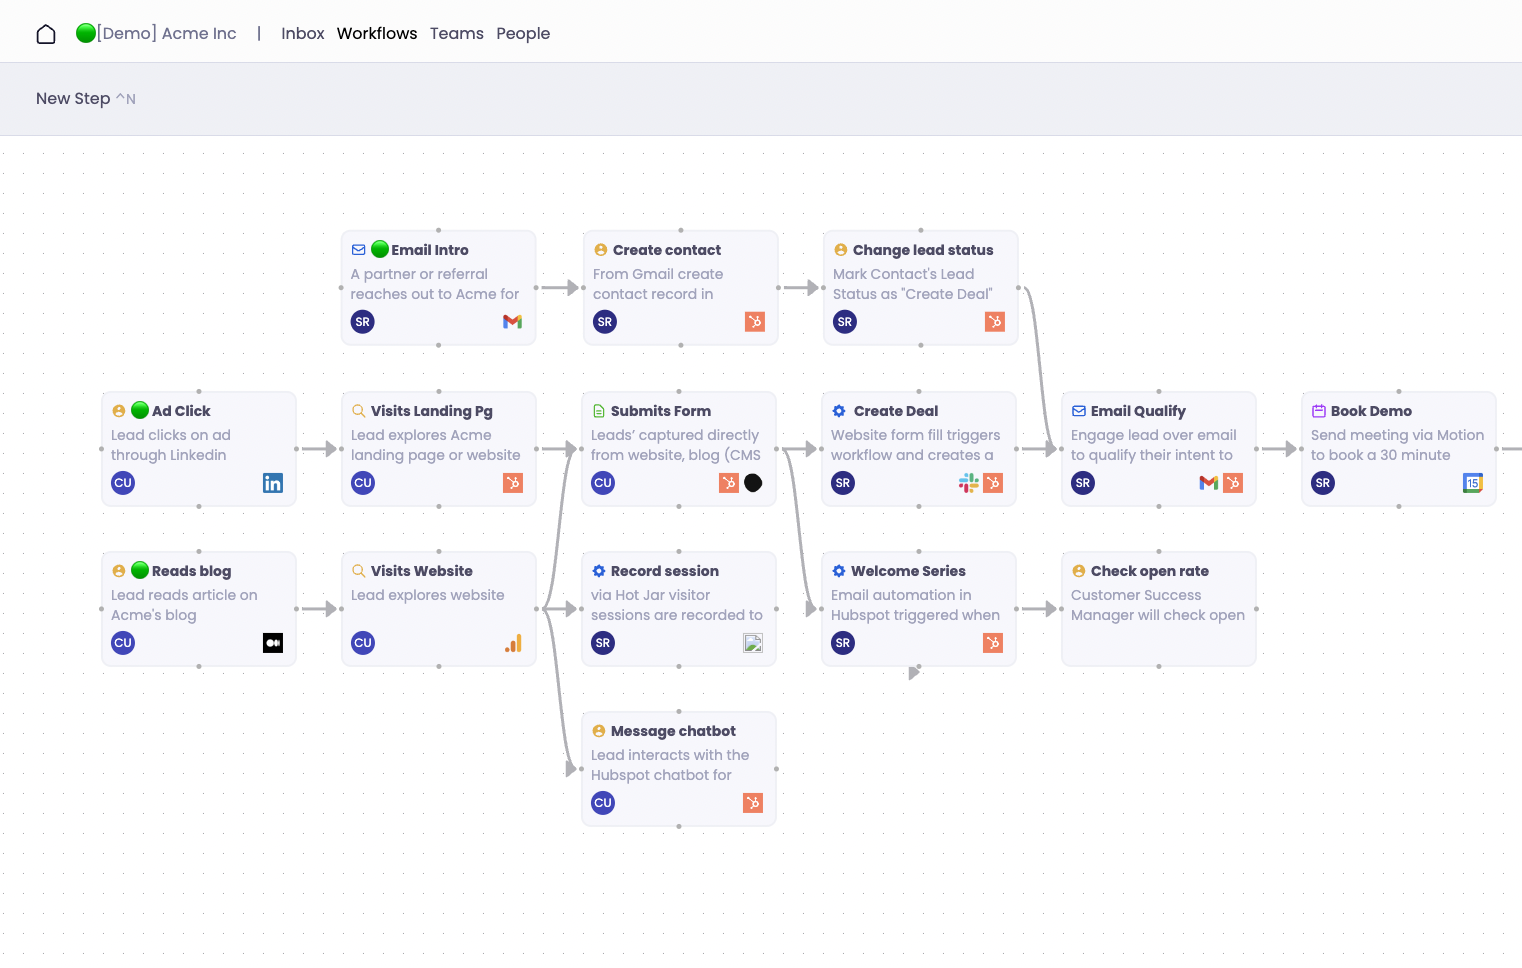 Sample process map in Puzzle
You’d typically use a process mapping tool like Puzzle to map your processes, but I reckon you can sketch on paper too.
5 Types of Process Maps You’ll Likely Create
There are several types of process maps you can create, but I find these five often sufficient for most people’s needs:
1. Basic process maps
These simple flowcharts provide the most basic details of a process.
Typically, they’d show only the inputs and outputs and are best for mapping single-stakeholder projects before you get into granular details. Here’s an example of a basic content creation process map:
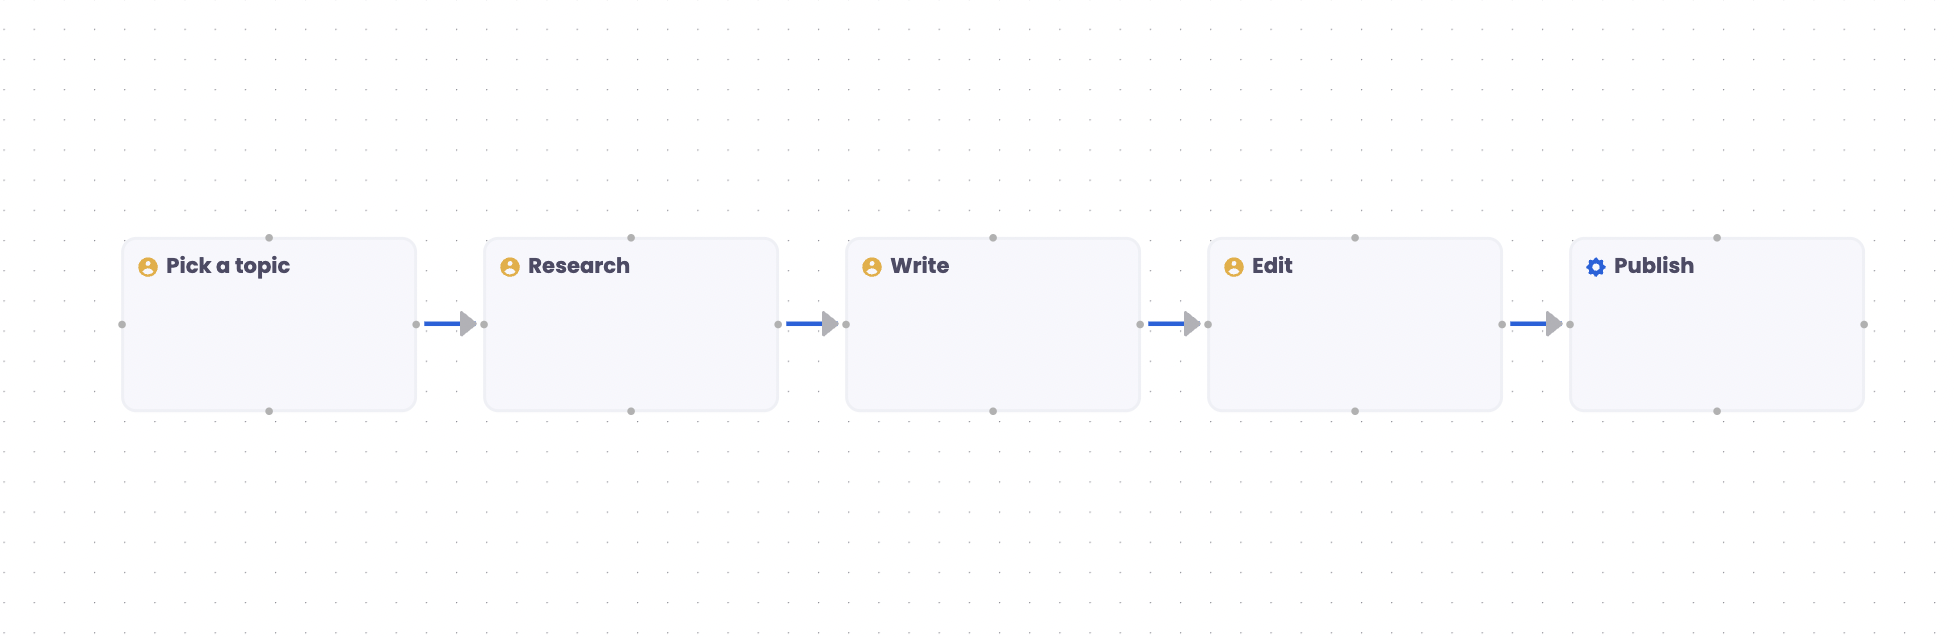 A basic process map in Puzzle
2. SIPOC process maps
These process maps show a high-level overview of processes across suppliers, inputs, processes, outputs, and customers (SIPOC).
Create this to see all the critical components of your processes at a glance — before you dive into the individual processes that enable your operations.
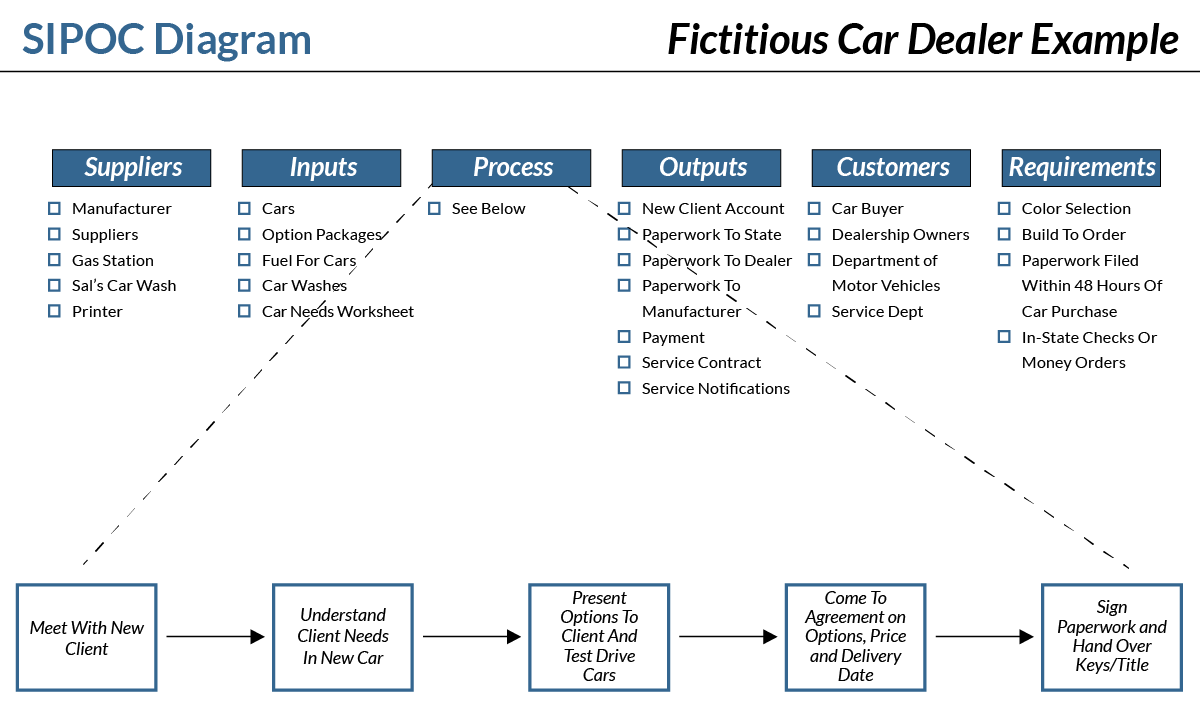 Sample SIPOC map (Source: I Six Sigma)
3. Cross-functional process maps
These process flowcharts show the relationships between two or more departments or stakeholders. They’re essential for mapping out dependencies between people or systems, so outputs don’t get held up.
They also improve cross-functional (i.e., interdepartmental) communication and collaboration and help determine redundancies in your process.
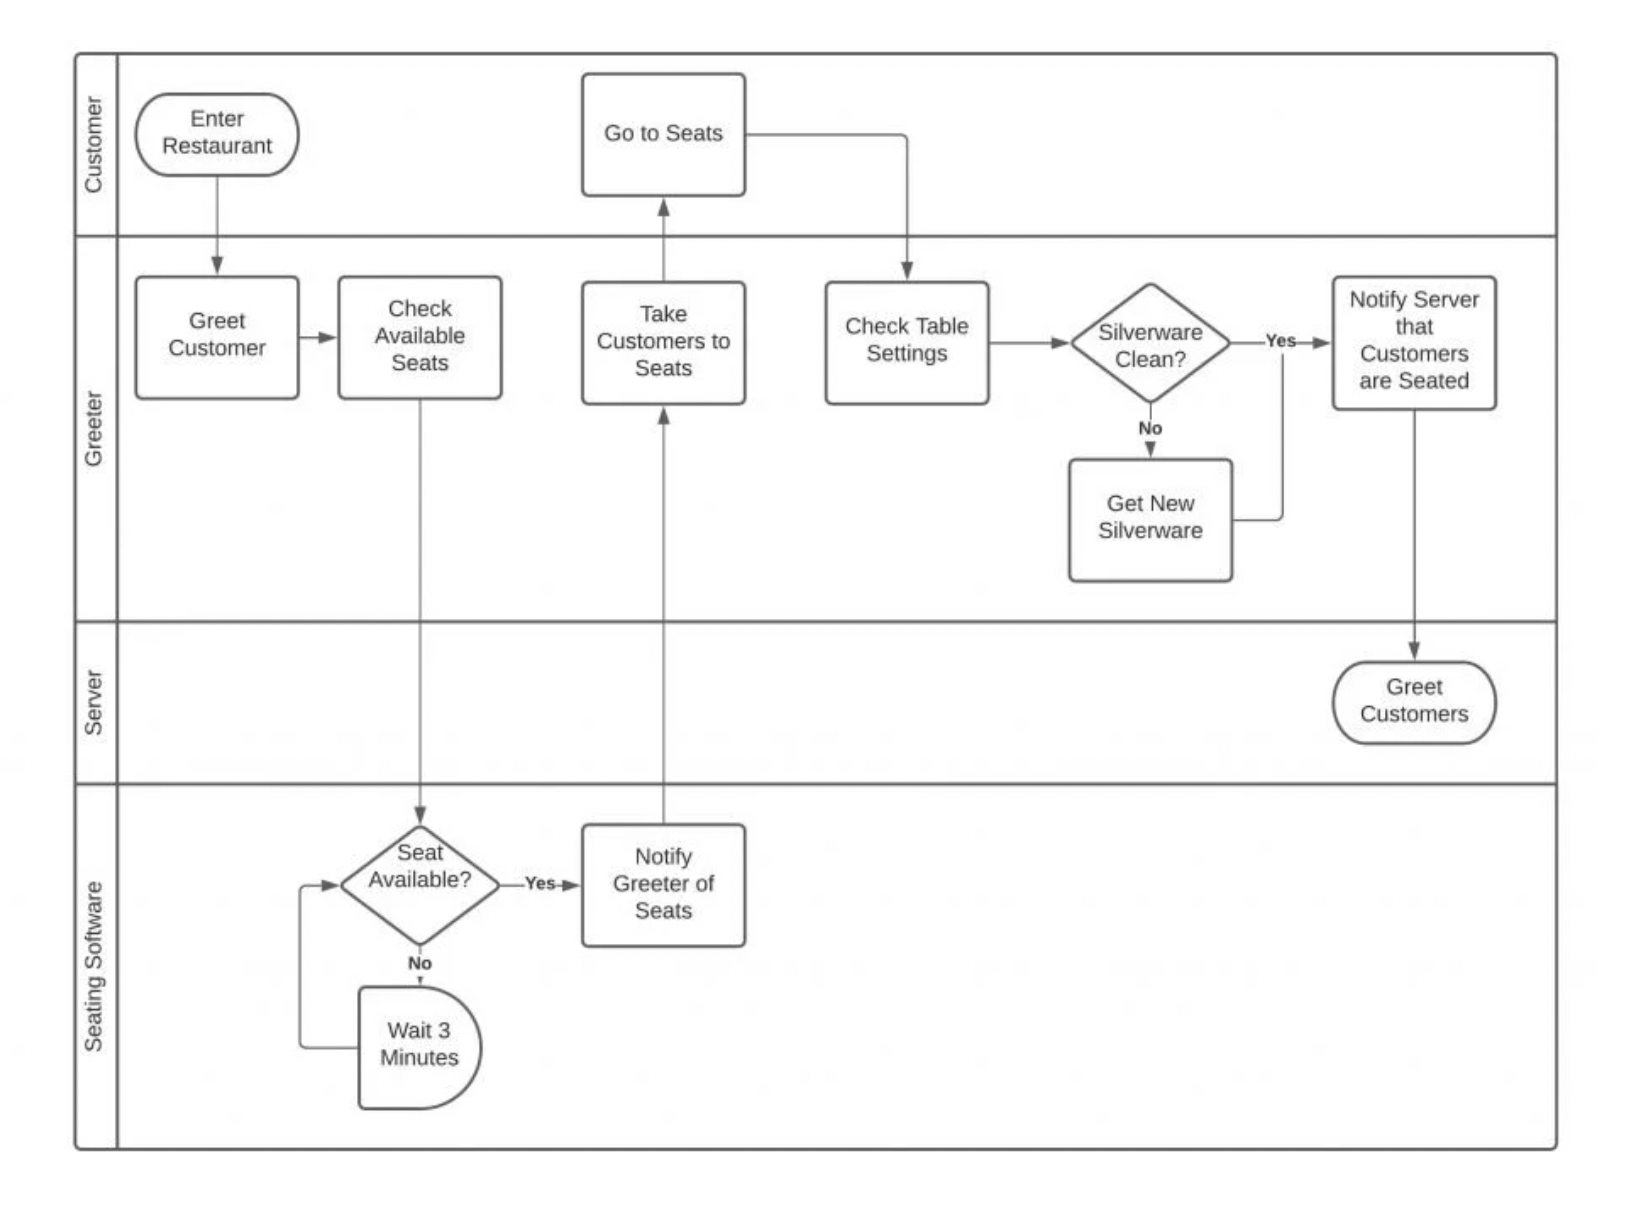 Example of a cross-functional process map
4. Detailed process maps
These are drill-downed versions of processes, which provide details about subprocesses, including the tasks, tools, and people involved in each process.
 A process map in Puzzle, with pop-out details for each step
5. Value stream maps
Value stream maps are a lean six sigma technique that allows you to document the steps you’ll need to create and deliver a product or service to customers.
It helps identify wastes you can reduce within your processes.
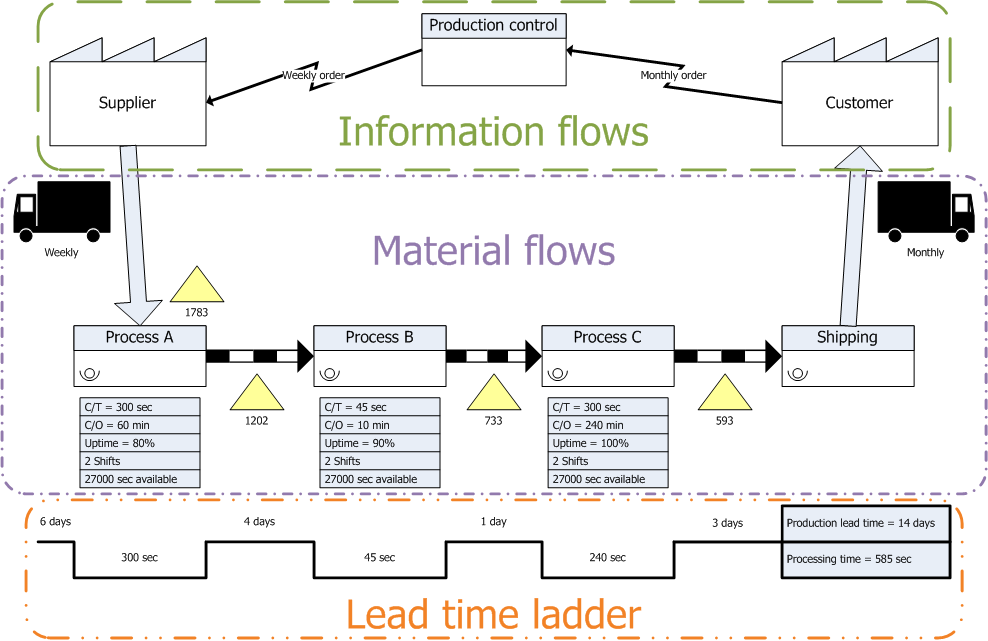 Sample Value Stream Map (Source: Wikipedia Commons by DanielPenfield)
Why Even Map Your Operations Processes?
Process maps help you understand your current workflows and allow you to spot opportunities for improvement (if any).
If you have airtight processes, then a process map serves as documentation to support people through standard work.
It improves communication and collaboration and retains knowledge that would be otherwise lost when key employees leave.
“Process maps remove the liability of tribal knowledge (essential work knowledge that lives only in your employees’ minds)... that just doesn't show up on the balance sheet.”
Let’s take a closer look!
1. Detect inefficiencies and resource misuse:
Process maps bare your workflows, so everything is visible. That visibility means you spot steps that add no value to the workflow and redundancies that often lead to waste.
That’s how we found that we could save Avail Dental one full hour per day using process automation for repetitive tasks they performed often. Read the case study!
2. Increase customer satisfaction:
Process maps let you walk through your customer-facing processes to see where your interactions may not meet client expectations. E.g., having clients manually fill in the same information more than once.
3. Create documentation for easy knowledge transfer:
NASA once lost a $193 million spacecraft because the team entered measurements in the wrong metric system. These are the kind of errors process mapping can remove with protocol documentation.
Suppose someone’s out of the office or on maternity leave. Or if someone quits and doesn’t give 2 weeks' notice. You have all this documentation where you can easily understand how a person does their job. You’d use this documentation to train new staff or employees stepping into new roles.
4. Delegate responsibility:
Since there’s process visibility and documentation, it becomes easy to assign work across roles.
5. Increase employee productivity and job satisfaction:
There’s a map that shows employees exactly what to do next. That’s mind space freed up for more productive work. And they can spend time on their core tasks without worrying about admin tasks you can automate. All this is super important because satisfied employees positively influence customer loyalty.
6. Increase cross-departmental understanding:
The more a person knows about the business, the better their decisions to improve it. Process mapping allows departments to understand the processes of other departments — giving everyone a broader picture of how the organization works.
7. Communicate ideas with stakeholders clearly:
Process maps (at least the process maps we create in Puzzle) take your ideas from the long boring text to interactive visuals. You can show the big picture, then zoom in to illustrate ideas, execution, tools, and responsibilities on a granular level. We’ve seen an increase in stakeholder buy-in as a result.
8. Make decisions faster:
Business process mapping allows you to notice and remove communication blockers. Better communication coupled with easier collaboration means your team makes better decisions faster.
9. Meet business compliance standards:
Because your processes are streamlined and standardized, there’s less chance the person responsible for completing a compliance step misses it.
How to Create Business Process Maps to Improve Productivity
At the center of all those flowcharts, process mapping describes what’s happening, who is responsible for it, and how they get it done.
1. Identify a process to map
Prioritize processes that have the most significant impact on time and resource savings. Choose from processes that are:
- New — a process that isn’t standardized yet.
- Complex — a process that needs a concise roadmap.
- Inefficient — a process that needs improvement.
Tip! A process is complex if it has a series of separate tools, tasks, people, and dependencies it runs on. It’s likely inefficient if people frequently miscommunicate, have trouble finding things, and the percentage cost of operation keeps growing.
2. List your current steps to complete that process
In client process audits, we’ve found that there’s usually a disparity between what most people think their process is versus what it is.
If you map your processes based on your ideal — rather than what you have — you miss out on opportunities to see time and resource sucks. Those are important to learn so that you can mitigate them when you create processes in the future.
Walk through the process with the people currently involved and document every step, no matter how small.
3. Write down the order of those steps
This is the part that unveils task dependency. Ask yourself, what is the first step of the process? What follows next? Write those down until the end of the process.
For example, if it’s a map for your project management process, your order of steps may look like this:
- Decide project goals
- Create a business case
- Complete the project charter
- Draw up the list of stakeholders
- Define the scope of the project
- And so on!
4. Create a flow chart showing your ordered process’ steps
Enter your steps into a flow chart tool following the order you’ve written them in.
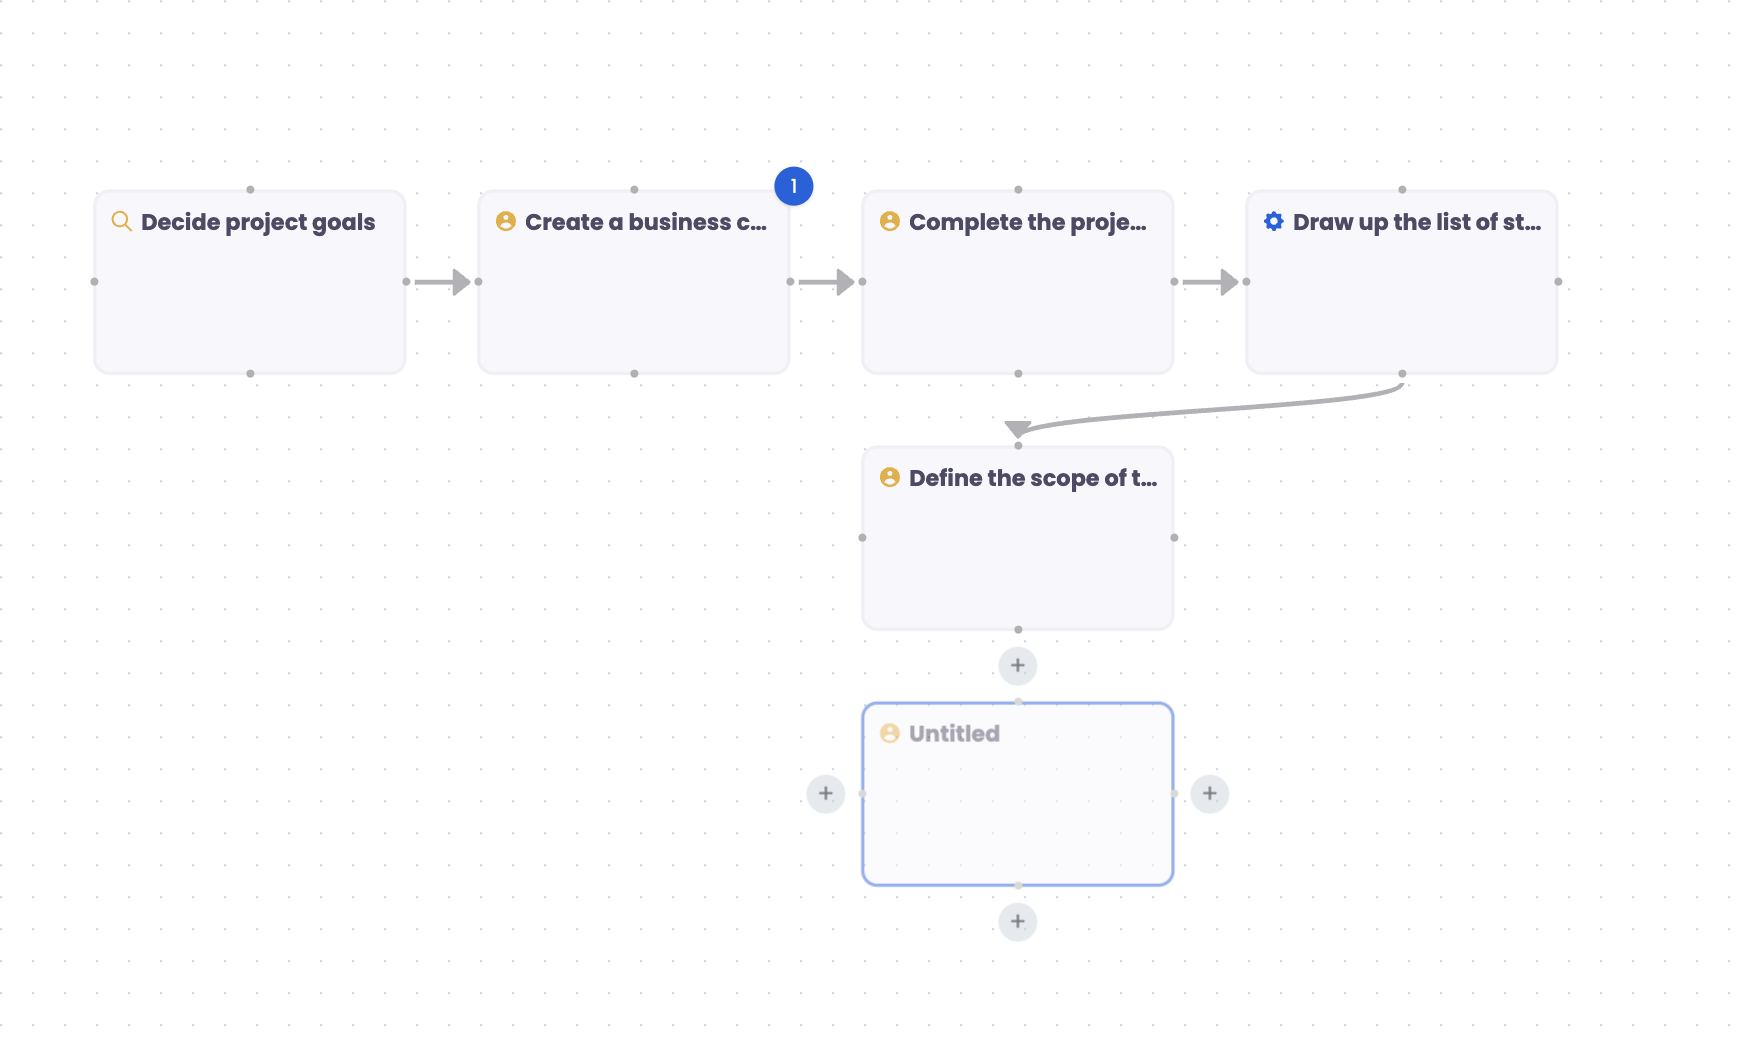 Creating a process flowchart in Puzzle
For complex processes, your flowchart arrows may be less linear — looking like this instead.
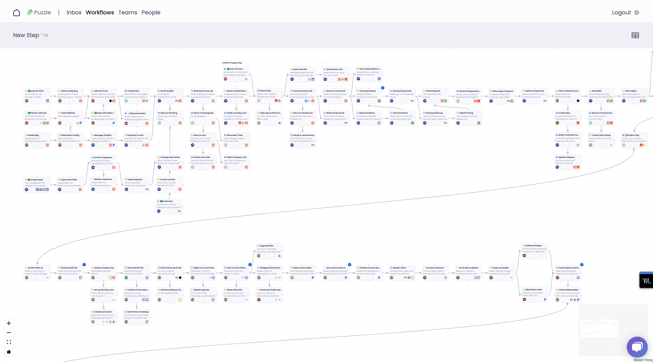 Complex process mapped in Puzzle
5. Identify the role responsible for each step
Who should perform each step in the process? Assign that based on skills, competency, and involvement. And this step isn’t limited to internal stakeholders alone.
A customer would be responsible for filling out forms in a customer acquisition process, whereas a sales rep would be responsible for sending a proposal.
If you use Puzzle, assigning roles to a step is as easy as clicking the step to open up the sidebar. Then you can assign one from the list of roles or create a brand new role.
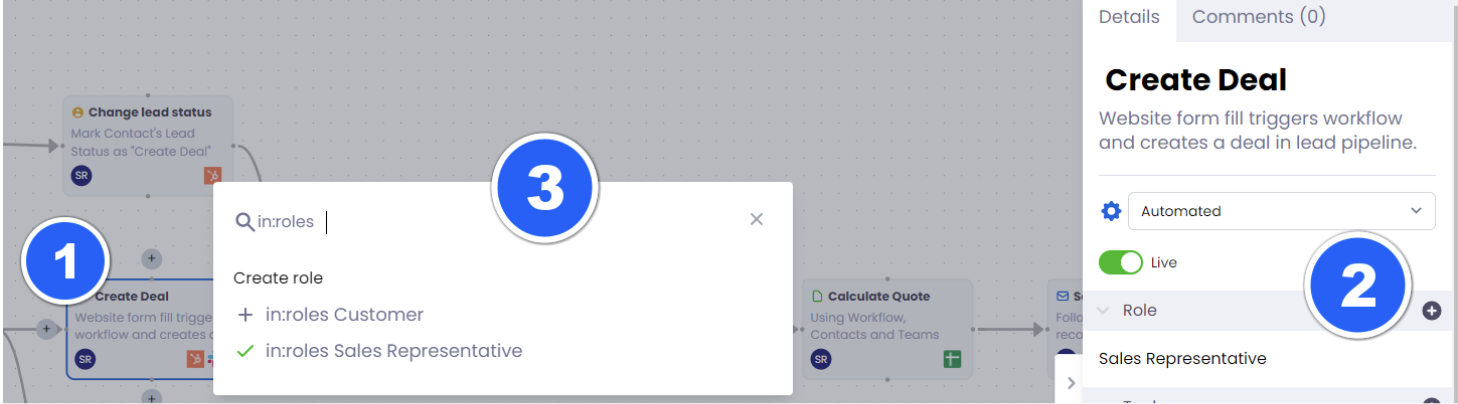 Assigning roles in Puzzle
A step can also have multiple roles where one person is responsible, and another is accountable, consulted, or informed (based on the RACI model).
6. Identify the tools used in each step
Remember the NASA metric misunderstanding that cost them millions? That’s the kind of problem identifying tools avoids.
Identify your best tools for each step, standardize using those, and assign them as the only tools for that step in your process map.
In Puzzle, you’d click the step again to open up the sidebar. Then you can assign a tool from the list of tools or integrate a brand-new tool.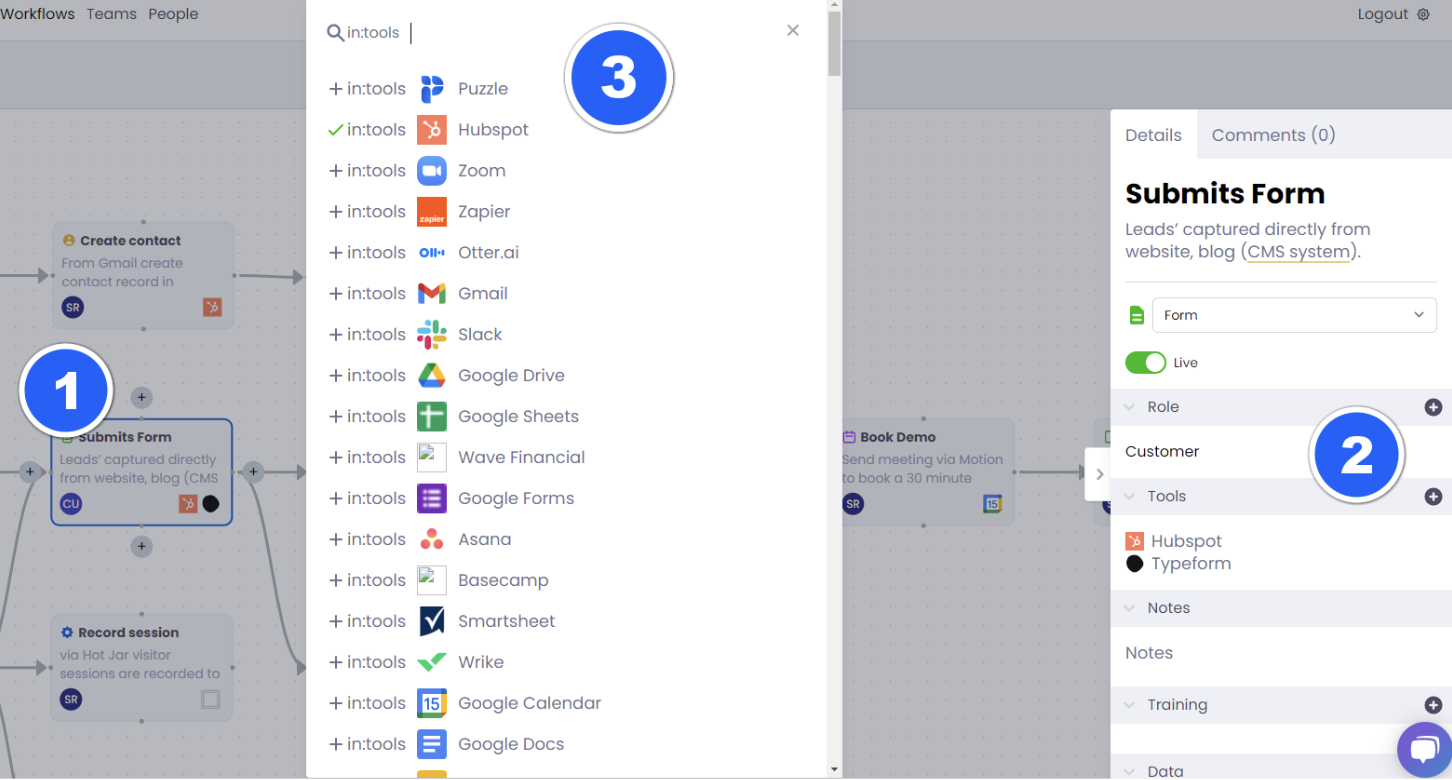
Assigning tools to steps in Puzzle
Tip! Look for opportunities to automate. A good indicator is when two sequential steps use different tools. It’s often possible to integrate the first step with the tool used in the second step. That way, you can automate some data entry and potentially save hours over a year.
7. Collaborate and analyze for opportunities to improve
Ask members of your team to point out steps that are:
- Too long
- Confusing
- Repetitive
- Time-consuming
- Or just involves too many tools and people
This is where you need a sophisticated tool, so things don’t get lost in the shuffle — which defeats the purpose of mapping for process optimization.
We ask team members to add how long each step within their roles takes and how often they repeat that step each month. Right there in the tool!
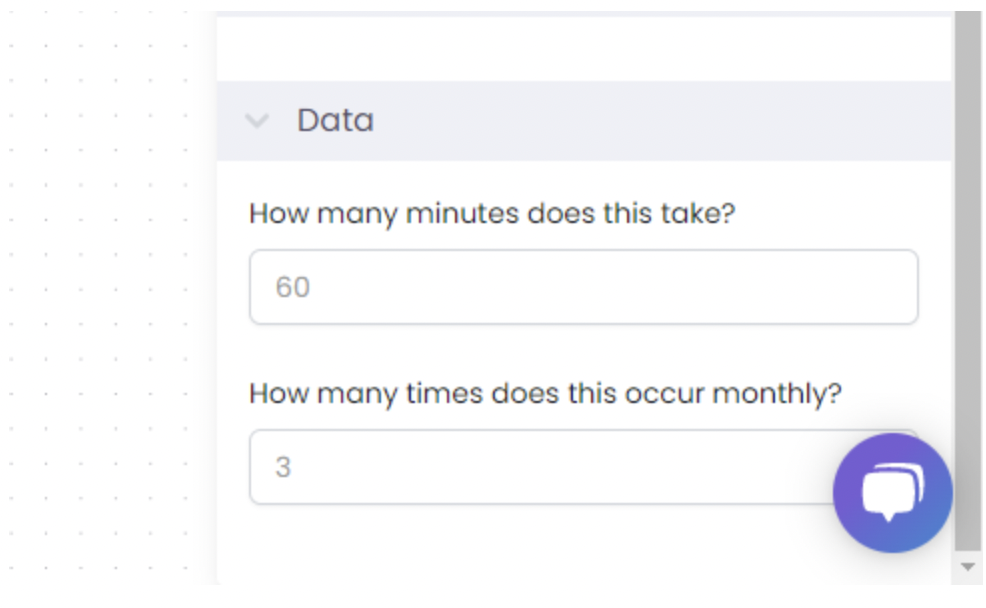 The data tab in Puzzle enables collaboration
With this info, everyone can see which step needs to be outsourced or automated. We can easily benchmark the step against its value and the hourly wage of the person performing it.
Tip! Prioritize the steps that people spend the most time on or steps that happen more frequently. Finding more efficient ways for your most frequent or tedious tasks will unlock growth opportunities.
We also use the comments bar to have conversations within the context of the process step.
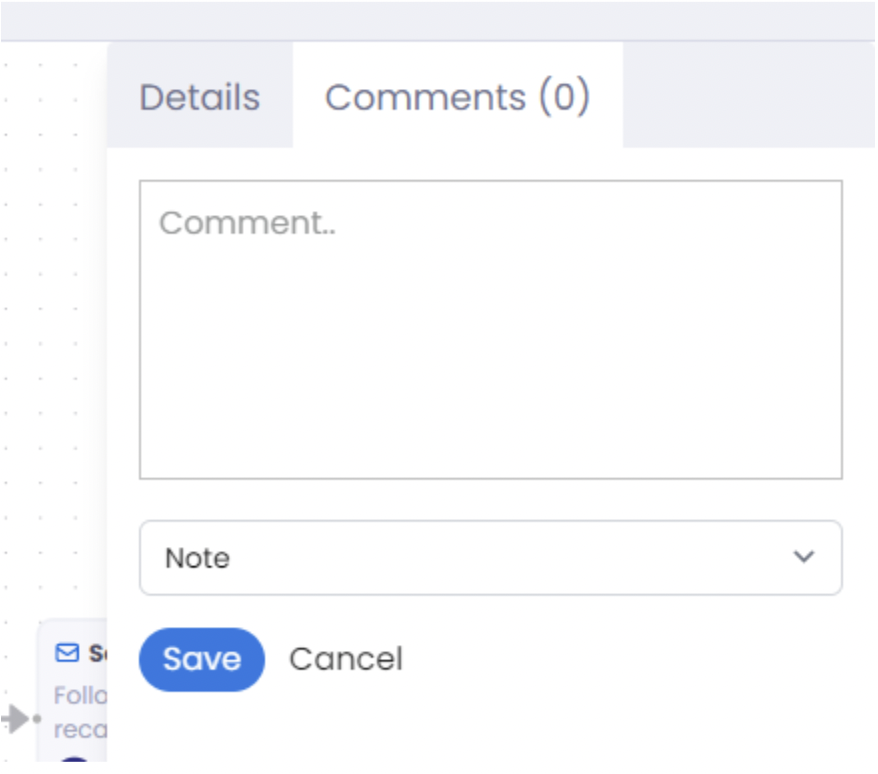 Commenting in Puzzle process builder
We’re an async team, so sometimes, there are many comments when I wake up. I typically rely on the inbox feature to see all of the comments across those steps, so I don’t miss anything.
That way, I can quickly answer them or jump to that step, to see what they're talking about.
We automated 83% of Payflo’s sales process using this tool — saving them from over 8,000 manual entries per month — using these collaborative features for analysis. Read the case study here.
Launch your first process map!
While it is hard to nail right the first time, process mapping isn’t as complicated as it may seem. You just need to figure out what’s happening, who’s responsible for it, and how they accomplish it. Once that is done, collaborate with your team members to analyze your mapped process for inefficiencies.
Remove those inefficiencies, and your organization will save thousands of dollars on unnecessary tools and wasted employee time.
Feeling stuck? Create your first process map with expert help. Book a demo now!
FAQs
What is process mapping in operations management?
In operations management, process mapping is a tool used to illustrate the workflows and activities that power business outcomes. The goal is to identify opportunities to improve operational efficiency.
What are the 4 critical steps of the mapping process?
The four critical steps of the mapping process are: identify what’s happening, determine who’s responsible, understand how they accomplish it and collaborate to analyze for improvement.